“I not only use all the brains that I have, but all I can borrow.” ~ Woodrow Wilson
Information is everywhere: concepts, ideas, notions, facts, opinions…
There’s so much stuff out there that it starts becoming mind-numbingly meaningless or straight up overwhelming.
Whichever way you choose to interpret data, there’s always a way of seeing it beautifully.
That’s exactly what WikiBrains does. A data visualization platform, it takes information and makes it worth looking at, allowing us to view connections in wonderfully whimsical bubble maps.
Because the information is crowd-sourced, it also gives us the freedom to change the way in which connections are made.
See the Energy map below and click on the image to check out the real-time movable bubble-map.
It’s important that we never stop learning, and a good way of doing that is to continually search for linkage among things that we value or find important. WikiBrains reminds us of that.
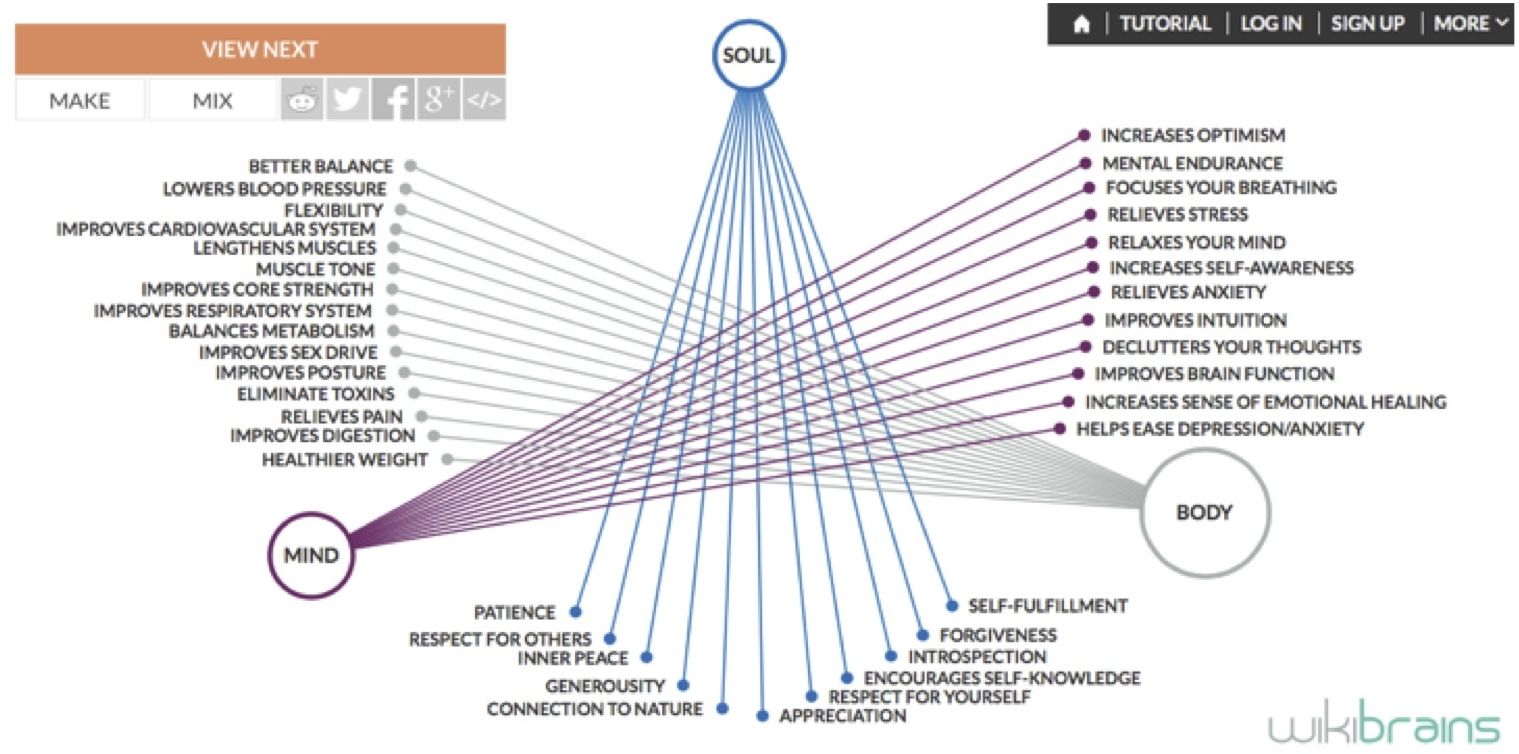
See the Yoga Benefits: Mind, Body & Soul map below:
Here are other maps related to yoga:
If we understand our roles not only as viewers, but also as connectors, then we can start to see information in new and more personally meaningful ways.
Love elephant and want to go steady?
Sign up for our (curated) daily and weekly newsletters!
Apprentice Editor: Jessica Sandhu/Editor: Rachel Nussbaum
Photos: Flickr/wikibrains


Read 0 comments and reply